Tag: infographic

BID by the numbers: New data reveals time-savings, more empowered decision-making among health workers
Nov 29, 2018
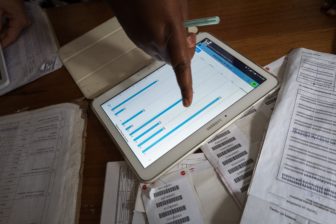
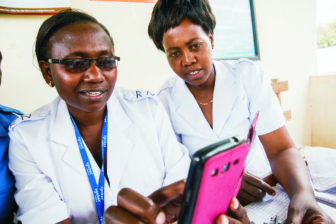
Beatrice Owawa is a Reproductive and Child Health nurse at the Usa River Health Center in Tanzania, one of more than 1,500 health facilities implementing data quality and use interventions across Tanzania and Zambia in partnership with the BID Initiative. As she toggles between dashboards on her tablet, you would never know it, but Beatrice used to depend on pen and paper for documenting her facility’s immunization clinics.
Read More
BID Story launches celebrating the transformative power of data and country ownership
Nov 14, 2018
Five years. Two electronic immunization registries (EIRs). Nineteen design countries who regularly input to the BID Learning Network. Study visits to Benin and Chile to learn from others implementing health information systems. More than half a million children registered in both EIRs, and 1,580 health facilities implementing data quality and use interventions, allowing health workers to collect, analyze, and act upon immunization data in real time.
Read More
How do we improve health around the world?
Feb 24, 2016
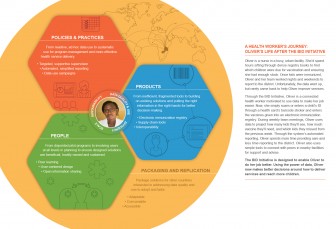
Improving poor data quality and use is a complicated problem to solve. There isn’t a single, one size fits all solution that can truly address this challenge in a scalable, sustainable way. At the BID Initiative, we believe that the collection of multiple interventions is key to helping address data quality and use challenges. We need a holistic investment in data management policies and practices, information system products, and the people who will use them.
Read More